
How to Evaluate RAG Systems: The Complete Technical Guide
Master RAG evaluation with precision, recall, faithfulness metrics. Complete implementation guide for measuring retrieval-augmented generation success.

1. Introduction
Retrieval-Augmented Generation (RAG) is reshaping how AI applications work. A 2025 survey shows 70% of AI engineers either have RAG in production or plan to deploy it within 12 months. But here's the challenge: traditional LLM evaluation only tells half the story.
Standard metrics like BLEU and ROUGE measure text generation quality, but RAG introduces a critical retrieval step that needs separate evaluation. You're now evaluating two components: how well your system finds relevant information and how effectively it uses that information to generate answers.
The key insight? Your chunking strategy, embedding quality, and search latency all impact the final result. Product managers must align evaluation metrics with user needs—faster answers, fewer errors, better citations—rather than defaulting to standard academic metrics.
2. Overview of RAG Evaluation Dimensions
Here are the essential areas to measure in any RAG system:
2.1 Retrieval Performance
Precision@k, Recall@k: How often does your retriever surface useful documents in the top-k results?
Context sufficiency: Does the retrieved content contain enough information for accurate answers?
2.2 Generation Quality
Answer relevance: How accurate and relevant are the generated responses based on retrieved context?
Faithfulness: Does the model stick to facts from the source material, or does it hallucinate?
2.3 System Performance
Latency and throughput: Response times and concurrent request handling capacity
Cost efficiency: Vector search and LLM inference expenses per query
2.4 User Experience
Satisfaction scores: Real-world feedback from actual usage
Task completion rates: How often users accomplish their goals in one interaction
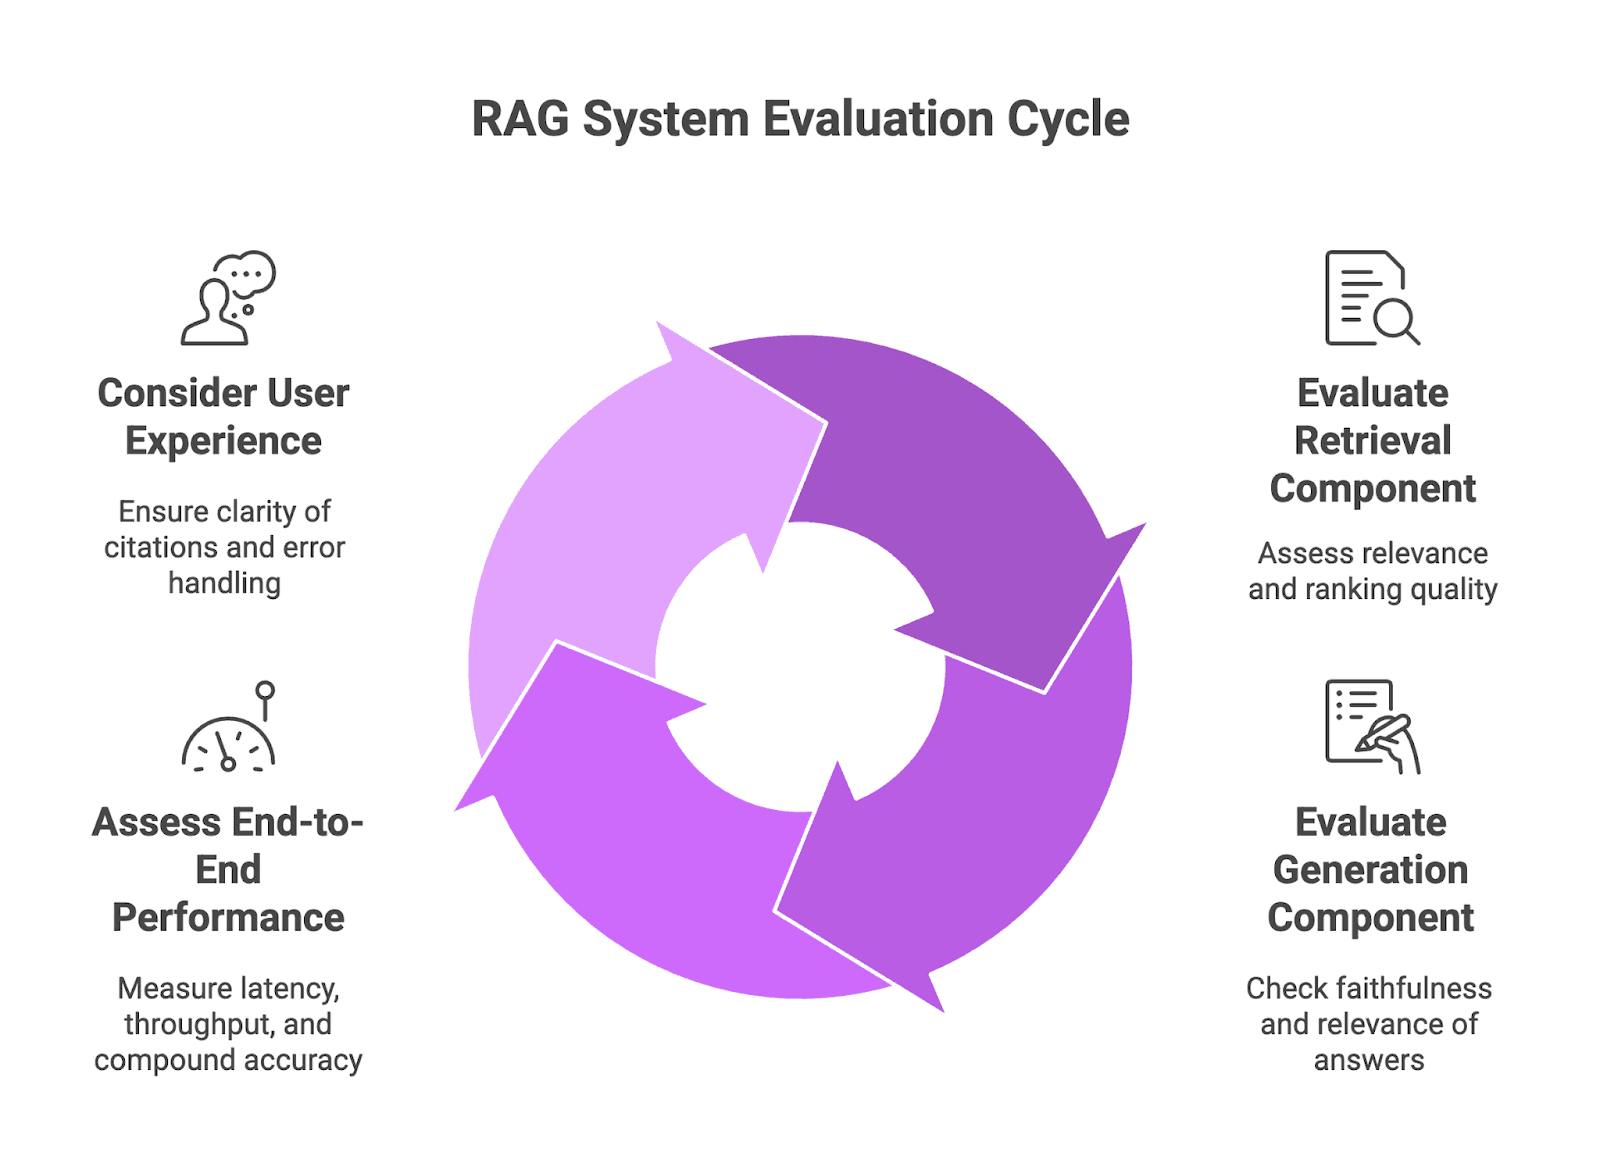
3. Understanding RAG System Components
3.1 Retrieval Component Evaluation
Relevance Metrics: Track Precision@k and Recall@k to see if your top-k results include the right passages. These metrics show whether your retriever finds the information your model actually needs.
Ranking Quality: Use NDCG (Normalized Discounted Cumulative Gain) or MRR (Mean Reciprocal Rank) to ensure the most useful documents appear at the top, not buried in lower positions.
3.2 Generation Component Assessment
Answer Faithfulness: Measure how strictly your generator sticks to retrieved context by calculating hallucination rates. This flags when the model invents information instead of using source facts.
Response Relevance: Compare generated answers against reference responses using accuracy metrics (F1, BLEU, ROUGE) to verify the output actually answers the question.
3.3 End-to-End System Performance
Latency Monitoring: Time the entire process from query to response, especially under load. Track average response times and peak queries per second to ensure scalability.
Compound Accuracy: Score final answers based on correctness and context fit. This ensures improvements in one component don't hurt overall performance.
3.4 User Experience Considerations
Citation Clarity: Show users exactly where information comes from with clickable sources. This builds trust faster than bare answers.
Error Handling: Provide clear messages and fallback options when retrieval fails or generation stalls, preventing user frustration.
4. Core RAG Evaluation Metrics Deep Dive
4.1 Retrieval Quality Metrics
4.1.1 Contextual Relevancy
Contextual relevancy measures how effectively your retriever finds passages that truly match user queries. Evaluate by comparing retrieved chunks against human-labeled relevant documents.
Measurement: Calculate Precision@k and Recall@k by counting true positives in top-k results versus all relevant documents.
Benchmarks: Aim for Precision@5 ≥ 0.7 in specialized domains and Recall@20 ≥ 0.8 for broader datasets.
4.1.2 Retrieval Precision and Recall
These metrics show whether your retriever finds useful documents without overwhelming results with irrelevant content.
Hit Rate: Percentage of queries returning at least one relevant document in top-k positions. Target 90% hit rate at k=10 for FAQ systems.
Mean Reciprocal Rank (MRR): Average reciprocal rank of the first correct document across queries. Higher MRR means faster access to relevant information.
NDCG: Considers document relevance and position, penalizing good results that appear too low. Target NDCG@10 > 0.8 for optimal ranking.
4.2 Generation Quality Metrics
4.2.1 Answer Relevancy
Measures whether the generator effectively uses retrieved context to deliver on-target responses.
Sentence-Level Analysis: Break responses into sentences, identify relevant ones, then calculate the ratio of relevant to total sentences.
Semantic Similarity: Use tools like SBERT to rate each sentence against ideal context beyond simple word matching.
4.2.2 Faithfulness/Groundedness
Ensures your LLM stays true to retrieved information without inventing details.
Source Attribution: Verify each fact in responses links back to retrieved passages. Calculate the percentage of properly sourced claims.
Hallucination Detection: Use automated checks for entity consistency or filters highlighting unsupported information.
Factual Consistency: Apply fact-verification models to every claim, then aggregate results into an overall consistency score.
4.3 End-to-End Performance Metrics
Response Latency: Measure complete query-to-answer time, noting median and 95th-percentile response times during peak usage.
Cost per Query: Sum vector search expenses, LLM token usage, and external API costs. Track average cost per 1,000 queries for budget planning.
User Satisfaction: Collect direct feedback through ratings or thumbs up/down responses, converting to overall satisfaction rates.
Task Completion Rates: Monitor the percentage of sessions where users achieve their objective in a single interaction.
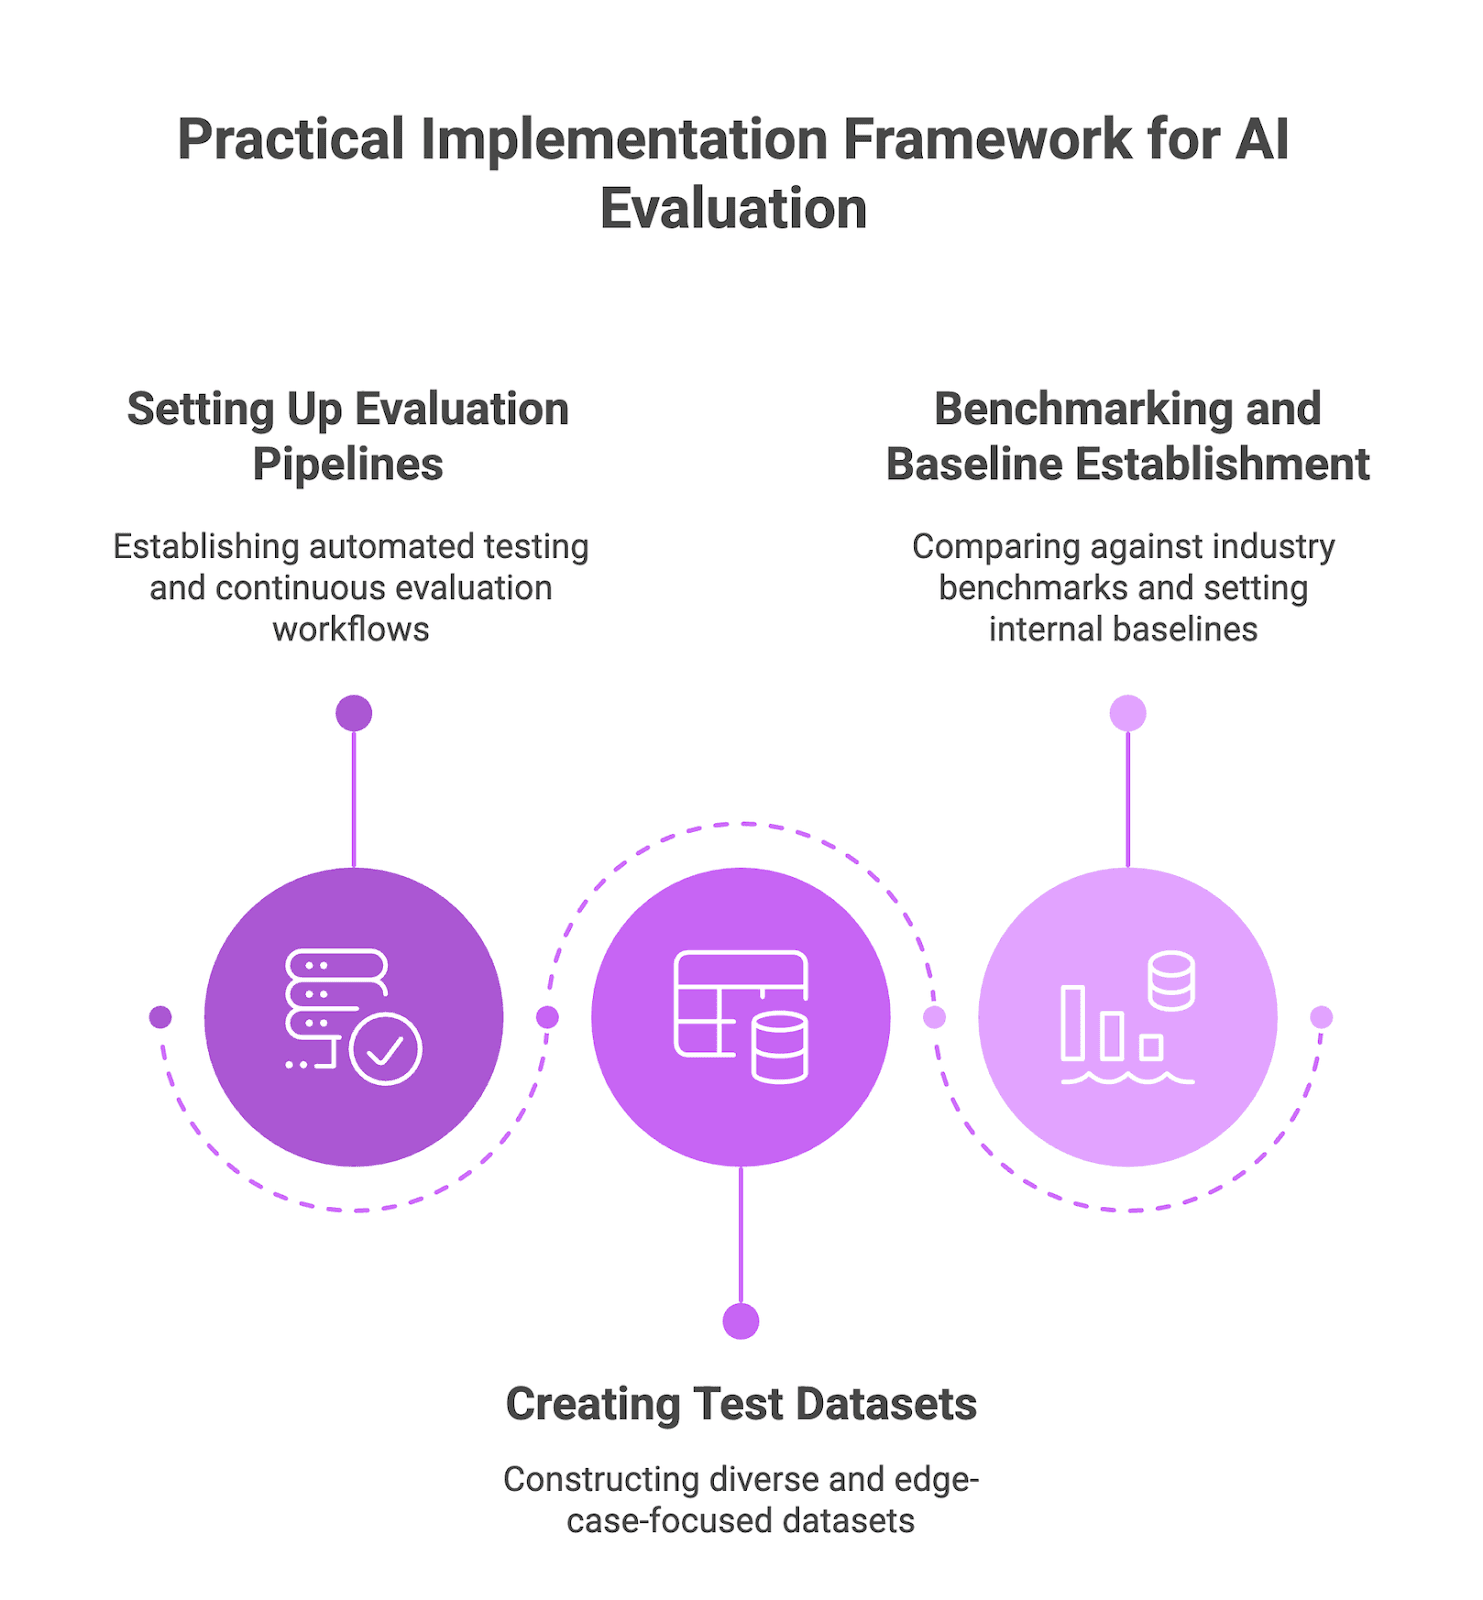
5. Practical Implementation Framework
5.1 Setting Up Evaluation Pipelines
5.1.1 Automated Testing Infrastructure
Build a testing harness that runs with every data or model change to catch regressions early. Start with modular scripts, then move to CI/CD for production stability.
Key components:
Collect retrieval, generation, and end-to-end metrics in single runs
Store structured results (JSON/parquet) with version tags
Implement automatic fail gates (e.g., block deployment if Precision@5 drops below rolling mean)
5.1.2 Continuous Evaluation Workflows
Move beyond ad-hoc testing to automated loops that sample recent traffic and test against current and candidate systems.
Implementation steps:
Set up nightly/hourly jobs pulling new queries (PII removed)
Use regression charts showing retrieval vs. generation performance
Display latency percentiles and accuracy on unified dashboards
5.1.3 Integration with Existing Systems
Connect evaluation directly to CI/CD and observability rather than running separately. Send metrics to your existing time-series databases so engineers can correlate performance spikes with deployments.
5.2 Creating Test Datasets
5.2.1 Dataset Construction
Build datasets with clear query-answer pairs and labeled relevant documents. Include challenging semantic cases, paraphrases, and multi-hop questions—not just simple matches.
Best practices:
Source queries from logs, bug reports, and knowledge base content
Limit gold document sets to focused lists (top 3 authoritative passages)
Store labelling provenance for audit trails
5.2.2 Diverse Query Set Development
Ensure breadth so embeddings and re-rankers don't overfit narrow use cases. Mix query types: factual, procedural, comparative, troubleshooting, and real user shorthand.
Techniques:
Cluster production queries by embedding similarity and sample from each cluster
Generate synthetic variants with LLMs, then manually validate quality
Include time-sensitive queries to monitor index freshness
5.2.3 Edge Case Coverage
Edge cases often create user frustration. Include queries with typos, uncommon entities, overlapping intents, and near-duplicate documents.
Focus areas:
Questions without direct answers (test model's ability to decline/clarify)
Long-tail queries from low-frequency logs
Multi-language or formatting-error queries
5.3 Benchmarking and Baseline Establishment
5.3.1 Industry Benchmark Alignment
Connect internal metrics to common benchmarks so stakeholders understand system maturity. Use standard metrics like Precision@k, Recall@k, MRR, NDCG for consistency across teams.
5.3.2 Internal Baseline Setting
Establish realistic baselines before optimization to ensure improvements are genuine. Create full metric snapshots with stable builds, freeze as baseline v1, and run multiple cycles to distinguish real movement from noise.
Guidelines:
Set target bands based on early user feedback (e.g., MRR +0.05, groundedness ≥ 0.9)
Separate functional baselines (accuracy, groundedness) from operational ones (latency, cost)
Rebaseline only for major schema or model family changes
5.3.3 Progress Tracking Methods
Use time series and comparative tables instead of point-in-time checks. Plot moving averages to reduce noise while maintaining sensitivity to sharp performance drops.
Implementation:
Automate weekly summary reports comparing metric deltas
Flag correlated shifts (e.g., cost increases with recall gains)
Archive milestone snapshots for future rollback decisions
6. Advanced Evaluation Techniques
6.1 LLM-as-a-Judge Methods
Use large language models with custom evaluation prompts to rate RAG outputs on style, faithfulness, and relevance. This method scales quickly and reduces manual labeling by automating rubric checks.
Challenges: Crafting precise prompts that minimize biases requires careful tuning. LLMs may inherit training data biases or struggle with consistent qualitative assessments across diverse tasks.
6.2 Human-in-the-Loop Evaluation
Integrate expert feedback into regular development cycles to catch rare failures that automated tests miss. Add expert review steps at critical development points where reviewers can identify hallucinations or context mismatches.
6.3 Multi-Dimensional Scoring
Combine retrieval, generation, and operational metrics into unified views. Integrate retrieval relevance, generation quality, and operational metrics like latency and cost into comprehensive scorecards that reveal trade-offs.
6.4 Bias and Fairness Assessment
Run scenario-based tests across demographic or content groups to identify performance gaps in retrieval and generation stages. Track fairness over time to ensure improvements don't widen gaps for underrepresented groups.
7. Best Practices and Common Mistakes
7.1 Metric Selection Guidelines
Choose a minimal set mapping directly to user and business goals. For RAG, this typically includes context relevance (retrieval), groundedness, answer relevance, and latency/cost to balance quality and efficiency.
Key Principles:
Align each metric with clear decisions (use Precision@k for chunking tuning, groundedness for deployment gates)
Include diverse data sources (benchmark, curated, synthetic) for score generalization
7.2 Avoiding Evaluation Pitfalls
Common mistakes include chasing aggregate scores that hide retrieval errors, overfitting prompts to synthetic judges, and ignoring drift in new query patterns.
Watch for:
Model bias creating feedback loops in LLM-based scoring
Regressions hidden by averages—track both edge cases and mainstream performance
7.3 Balancing Automated and Human Evaluation
Automation enables scale, but humans catch nuanced factual gaps, tone issues, and fairness problems that raw metrics miss.
Strategy: Combine LLM-as-judge for quick triage with smaller human-labeled sets to maintain quality and prevent drift. Conduct regular expert reviews on stratified samples.
7.4 Stakeholder Communication
Clear reporting keeps engineering, product, and leadership aligned on genuine progress. Provide concise scorecards (retrieval hit rate, groundedness, answer relevance, latency, cost) with one action item per metric.
Best Practices:
Show trade-offs explicitly (latency increases with recall gains)
Connect changes to user impact and risk reduction
Use visual dashboards for quick status assessment
8. Scenario-Based Recommendations
Enterprise Search: Use Precision@5 and Recall@20 to ensure top-ranked contexts cover key data, plus Groundedness to catch hallucinations.
FAQ/Help-desk Bots: Focus on MRR and Answer Similarity to verify users get correct information quickly, then monitor Cost per Query for budget control.
Real-time Support Tools: Add Response Latency and User Satisfaction Scores to balance speed with quality.
9. Streamlining RAG Evaluation with Future AGI
Implementing comprehensive RAG evaluation can be complex, but Future AGI simplifies this process significantly. The platform provides ready-made templates that score context relevance, groundedness, hallucination risk, and answer quality in single runs - eliminating the need to build evaluation infrastructure from scratch.
Key advantages include:
Integrated workflows with agent-based and LangGraph systems
Custom evaluation creation for domain-specific requirements
Built-in tracing to inspect document retrieval and generation influence
Automated batch processing that tracks accuracy ranges and hallucination patterns
This combination of built-in metrics and customizable evaluators enables teams to iterate faster on retrieval tuning and prompt optimization while maintaining consistent quality signals across deployments.
Conclusion
RAG evaluation requires a multi-faceted approach that goes beyond traditional NLP metrics. Success depends on measuring both retrieval effectiveness and generation quality while maintaining system performance and user satisfaction.
The key is choosing metrics that align with your specific use case and user needs. Start with core metrics (context relevance, groundedness, answer quality, latency), establish baselines, and build automated evaluation pipelines that scale with your system.
Remember: the best RAG system isn't the one with the highest benchmark scores—it's the one that consistently helps users accomplish their goals efficiently and accurately.
FAQs
Why is RAG evaluation more complex than standard LLM evaluation?
RAG evaluation must judge both how well the retriever finds the right context and how faithfully the generator uses that context, while standard LLM tests focus only on generation quality.
What are key metrics for measuring retrieval quality in RAG systems?
Core retrieval metrics include Precision@k and Recall@k to check result relevance, Mean Reciprocal Rank (MRR) for first-hit speed, and Normalized Discounted Cumulative Gain (NDCG) for rank weighting.
How do you measure faithfulness in RAG-generated responses?
Faithfulness is assessed by verifying source attribution accuracy and calculating a hallucination rate using methods like named-entity consistency checks or fact-verification models.
How does Future AGI help in RAG evaluation?
Future AGI provides built-in RAG evaluation templates, OpenTelemetry-powered tracing, and no-code customization so teams can automate context relevance, groundedness, hallucination risk, and answer quality checks in one platform
What challenges are you facing with RAG evaluation in your organization? Share your experiences in the comments below.